Top 100 universities with the best student-to-staff ratio
Universities with more staff per student have a good chance of creating an engaged and interactive teaching environment. These are the top 100 universities in the world with the best ratios of students to teachers.
- Rankings
- Rankings for Students
Share
This is the 2016 ranking. Access the most recent table here
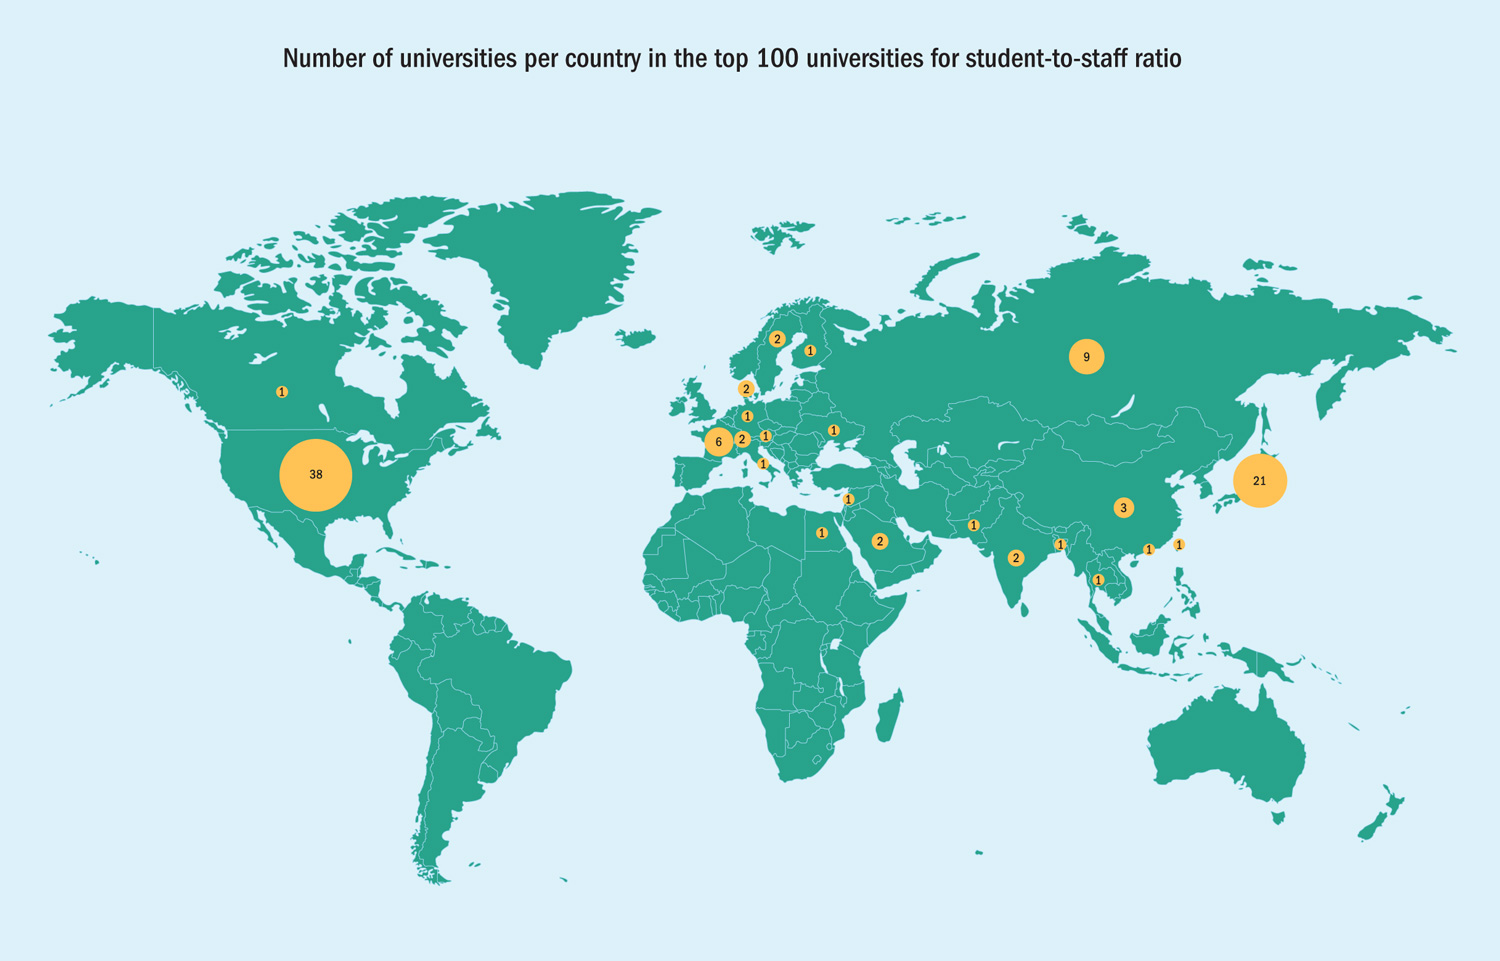
The top 100 universities with the best student-to-staff ratios are predominantly US colleges, closely followed by Japanese institutions.
Not a single UK university appears in the list, which includes institutions across 23 countries in North America, Europe, Asia and the Middle East.

Unsurprisingly, the universities with the fewest students per staff member are small universities with a total enrolment of less than 5,000 students.
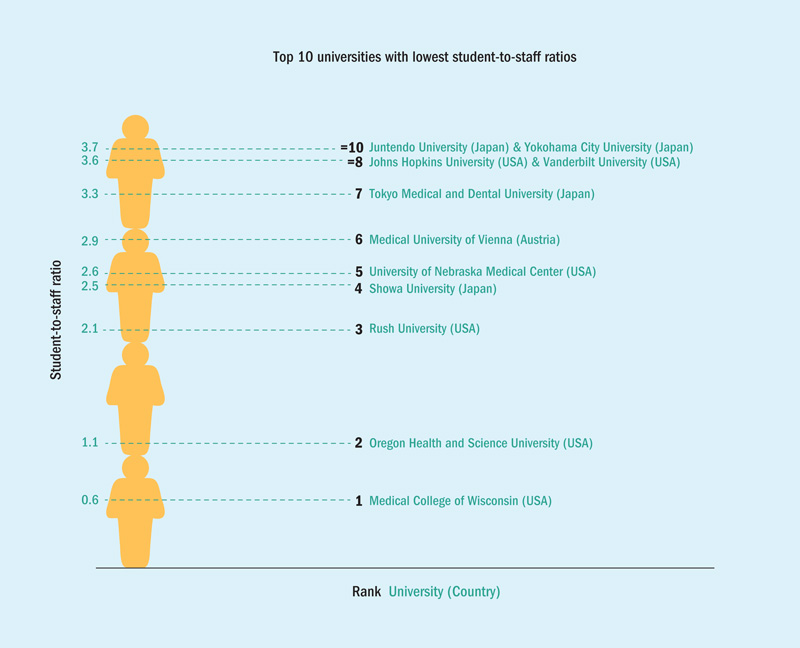
But many larger institutions, such as Johns Hopkins University in the United States, which has more than 15,000 students, also manage to maintain a favourable student-to-staff ratio. John Hopkins, which ranks in the World University Rankings 2016 in 11th position, has just over three and a half students for every staff member.
The University of Dhaka in Bangladesh has the same student-to-staff ratio despite counting more than 62,000 current students, making it the largest student body in the top 100.
All the top 100 are within the 600 best universities in the World University Rankings 2016; none has more than nine students for every staff member – well below the average 16.5 students per staff member for all 800 universities in the World University Rankings.
Outside the top 100, the UK university with the lowest student-to-staff ratio is University College London, which has 10.7 students per staff member.

At the Medical College of Wisconsin, there are in fact more staff than students, providing close attention and support for trainee doctors.
Although a low student-to-staff ratio does generally imply smaller class sizes, it is only a crude estimation of how much attention individual students will receive.
At least as relevant as average class size, which often varies by degree subject within the same university, is the number of hours students spend with their teachers.
While comprehensive data about contact hours for different courses at different institutions around the world are not easy to come by, prospective students can get a better idea of this, as well as other elements of the teaching environment at their desired colleges, by talking directly with current students.
Contact hours, like student-to-staff ratios, may be quantifiable, but even these data cannot tell you about how attentive and enthusiastic lecturers are, how quickly they reply to emails and turn around marked coursework, or what kinds of relationships they have with their students.
Nonetheless, having more staff relative to students is certainly a good grounding for creating a teaching environment with a high level of interaction, engagement and academic support.
At the University of Copenhagen – which is ranked in the top 15 – there are just over four students for every staff member, but current sociology student Malthe Agger reports having about 100 students in his lectures and 20 to 30 in workshops.
Even in the larger classes, he has managed to cultivate relaxed and informal relationships with his teachers.
He says: “I consider many of my professors as great academic icons, so I always make sure to talk to them in the breaks because not only are they always friendly and open, but I always learn new things every time I speak to them.
“I have never been afraid to ask a question during a lecture or student training. I think of many of my teachers as friends and equals, even though our degree and title might be different.”
Top 100 universities with the best student-to-staff ratios
|
Rank |
World University Rank 2016 |
University |
Country |
No. of FTE Students |
Student:Staff Ratio |
|
1 |
301-350 |
United States of America |
1,211 |
0.6 |
|
|
2 |
201-250 |
United States of America |
2,838 |
1.1 |
|
|
3 |
201-250 |
United States of America |
1,855 |
2.1 |
|
|
4 |
601-800 |
Japan |
3,675 |
2.5 |
|
|
5 |
351-400 |
United States of America |
2,857 |
2.6 |
|
|
6 |
201-250 |
Austria |
7,426 |
2.9 |
|
|
7 |
401-500 |
Japan |
2,872 |
3.3 |
|
|
=8 |
11 |
United States of America |
15,128 |
3.6 |
|
|
=8 |
87 |
United States of America |
12,161 |
3.6 |
|
|
=10 |
601-800 |
Japan |
3,955 |
3.7 |
|
|
=10 |
601-800 |
Japan |
4,122 |
3.7 |
|
|
12 |
501-600 |
Russian Federation |
18,808 |
4 |
|
|
13 |
82 |
Denmark |
27,545 |
4.1 |
|
|
14 |
12 |
United States of America |
11,751 |
4.4 |
|
|
=15 |
90 |
United States of America |
12,338 |
4.5 |
|
|
=15 |
158 |
United States of America |
9,390 |
4.5 |
|
|
=17 |
201-250 |
Sweden |
3,879 |
4.6 |
|
|
=17 |
201-250 |
United States of America |
7,326 |
4.6 |
|
|
=19 |
20 |
United States of America |
15,172 |
4.8 |
|
|
=19 |
101 |
France |
2,429 |
4.8 |
|
|
=21 |
167 |
Denmark |
9,990 |
5 |
|
|
=21 |
201-250 |
Japan |
17,200 |
5 |
|
|
23 |
401-500 |
Russian Federation |
20,836 |
5.2 |
|
|
=24 |
401-500 |
Taiwan |
4,496 |
5.4 |
|
|
=24 |
501-600 |
Canada |
13,438 |
5.4 |
|
|
26 |
164 |
United States of America |
6,753 |
5.5 |
|
|
27 |
88 |
Japan |
22,809 |
5.6 |
|
|
=28 |
43 |
Japan |
26,199 |
5.7 |
|
|
=28 |
60 |
United States of America |
12,528 |
5.7 |
|
|
=28 |
161 |
United States of America |
15,286 |
5.7 |
|
|
=31 |
79 |
United States of America |
26,485 |
5.8 |
|
|
=31 |
251-300 |
United States of America |
11,919 |
5.8 |
|
|
33 |
15 |
United States of America |
25,055 |
5.9 |
|
|
34 |
601-800 |
Egypt |
16,817 |
6 |
|
|
35 |
133 |
United States of America |
9,259 |
6.4 |
|
|
=36 |
17 |
United States of America |
20,376 |
6.5 |
|
|
=36 |
39 |
United States of America |
27,233 |
6.5 |
|
|
=36 |
104 |
Switzerland |
26,583 |
6.5 |
|
|
=36 |
351-400 |
United States of America |
23,618 |
6.5 |
|
|
=40 |
104 |
United States of America |
6,178 |
6.6 |
|
|
=40 |
195 |
Germany |
6,853 |
6.6 |
|
|
=40 |
601-800 |
India |
17,273 |
6.6 |
|
|
=43 |
401-500 |
Japan |
18,925 |
6.7 |
|
|
=43 |
601-800 |
Russian Federation |
4,441 |
6.7 |
|
|
=45 |
30 |
United States of America |
42,056 |
6.8 |
|
|
=45 |
401-500 |
United States of America |
10,297 |
6.8 |
|
|
=47 |
1 |
United States of America |
2,243 |
6.9 |
|
|
=47 |
10 |
United States of America |
14,221 |
6.9 |
|
|
=47 |
251-300 |
Russian Federation |
11,902 |
6.9 |
|
|
=47 |
601-800 |
Bangladesh |
62,716 |
6.9 |
|
|
51 |
601-800 |
Russian Federation |
5,395 |
7 |
|
|
=52 |
201-250 |
Hong Kong |
10,015 |
7.1 |
|
|
=52 |
401-500 |
Russian Federation |
7,131 |
7.1 |
|
|
=52 |
501-600 |
France |
15,619 |
7.1 |
|
|
=52 |
501-600 |
Saudi Arabia |
6,898 |
7.1 |
|
|
=52 |
601-800 |
China |
11,506 |
7.1 |
|
|
=57 |
201-250 |
Russian Federation |
17,155 |
7.2 |
|
|
=57 |
601-800 |
Japan |
9,137 |
7.2 |
|
|
=59 |
63 |
University of North Carolina at Chapel Hill |
United States of America |
26,518 |
7.3 |
|
=59 |
201-250 |
Japan |
9,586 |
7.3 |
|
|
=59 |
301-350 |
Russian Federation |
7,801 |
7.3 |
|
|
=62 |
501-600 |
Thailand |
27,402 |
7.5 |
|
|
=62 |
601-800 |
Japan |
8,051 |
7.5 |
|
|
64 |
601-800 |
Japan |
10,226 |
7.6 |
|
|
=65 |
161 |
Russian Federation |
30,822 |
7.7 |
|
|
=65 |
251-300 |
Sweden |
17,866 |
7.7 |
|
|
=67 |
3 |
United States of America |
15,596 |
7.8 |
|
|
=67 |
251-300 |
Japan |
23,144 |
7.8 |
|
|
=67 |
601-800 |
Pakistan |
9,808 |
7.8 |
|
|
=70 |
54 |
France |
2,400 |
7.9 |
|
|
=70 |
201-250 |
China |
14,290 |
7.9 |
|
|
=70 |
301-350 |
Japan |
15,529 |
7.9 |
|
|
73 |
201-250 |
École Normale Supérieure de Lyon |
France |
2,218 |
8 |
|
=74 |
251-300 |
India |
3,318 |
8.2 |
|
|
=74 |
301-350 |
United States of America |
3,837 |
8.2 |
|
|
=74 |
401-500 |
Japan |
18,162 |
8.2 |
|
|
=74 |
401-500 |
France |
6,137 |
8.2 |
|
|
=74 |
501-600 |
Japan |
14,686 |
8.2 |
|
|
=74 |
601-800 |
Ukraine |
22,686 |
8.2 |
|
|
=74 |
601-800 |
Japan |
6,248 |
8.2 |
|
|
81 |
42 |
China |
40,148 |
8.3 |
|
|
=82 |
7 |
United States of America |
7,929 |
8.4 |
|
|
=82 |
117 |
University of Maryland, College Park |
United States of America |
31,331 |
8.4 |
|
=82 |
251-300 |
Saudi Arabia |
35,889 |
8.4 |
|
|
=82 |
251-300 |
United States of America |
11,381 |
8.4 |
|
|
=82 |
601-800 |
Japan |
15,885 |
8.4 |
|
|
=87 |
94 |
United States of America |
15,408 |
8.5 |
|
|
=87 |
180 |
Italy |
769 |
8.5 |
|
|
=87 |
351-400 |
Finland |
14,056 |
8.5 |
|
|
=87 |
401-500 |
Switzerland |
4,358 |
8.5 |
|
|
=87 |
601-800 |
Japan |
12,460 |
8.5 |
|
|
=92 |
64 |
United States of America |
24,789 |
8.6 |
|
|
=92 |
601-800 |
Japan |
13,035 |
8.6 |
|
|
94 |
113 |
France |
27,862 |
8.7 |
|
|
=95 |
6 |
United States of America |
20,152 |
8.9 |
|
|
=95 |
501-600 |
American University of Beirut |
Lebanon |
7,695 |
8.9 |
|
=95 |
601-800 |
Japan |
7,519 |
8.9 |
|
|
=96 |
5 |
United States of America |
11,074 |
9 |
|
|
=96 |
21 |
United States of America |
41,786 |
9 |
|
|
=96 |
101 |
United States of America |
6,333 |
9 |
