The question of whether huge amounts of time and effort could be saved in the UK's research excellence framework by using metrics alone to determine outcomes has been a debate that has raged for many years.
Similar questions have now been thrown up about the country's teaching excellence framework after the latest set of results.
Analysis of the data by Times Higher Education shows that a statistical measure of how a university performed against benchmarks across the six “core metrics” in the 2018 TEF appears to be a good indicator of which institutions were awarded gold. Furthermore, a number of those universities that moved up an award from 2017 would already have achieved that result last year if the same statistical measure – the Z-score – was used to determine the outcome.
Z-scores show the statistical significance of the gap between a university’s performance on a metric compared with a benchmark value that accounts for some characteristics of the institution’s student intake.
They are used in the current TEF process to help determine if a university should receive a positive or negative “flag” on a particular metric. The number of such flags underlies whether an institution is initially thought of as gold, silver or bronze.
This year’s TEF data show that the nine higher education institutions that received a gold award all had average Z-scores across the six core metrics – course teaching quality, assessment and feedback, academic support, non-continuation, graduate employment or further study, and highly skilled employment or further study – way ahead of other universities, and most scored above three.
They include Swansea University and Durham University, both given silver awards last year despite also having relatively high average Z-scores across all the metrics that year. Meanwhile, among those given silver this time around after being awarded bronze in 2017 are clear examples of institutions, such as the University of Southampton and Trinity Laban Conservatoire of Music and Dance, that had average Z-scores close to zero in both years.
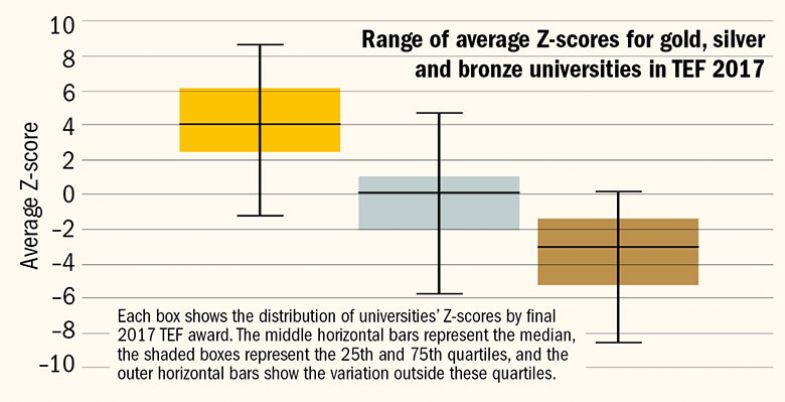
The overall spread of average Z-scores for the 2017 TEF suggests that they were a good indicator of the final award last year too – although it is notable that bronze and silver do overlap to an extent.
Taking the lead: average Z-scores for TEF 2017

However, Sir Chris Husbands, the chair of the TEF, points out that averaging Z-scores – which specifically represent the number of standard deviations a metric is from the benchmark – across several metrics with different distributions of data is statistically problematic as it “really is a matter of adding up apples and pears”.
Even individual Z-scores for each metric do not “give you any measure of materiality”, he adds, saying that just because an institution got a very high Z-score, that may simply be “because they are outliers in a very bunched distribution”.
“That is a statistical artefact rather than telling you anything about the performance of the institution,” said Sir Chris, vice-chancellor of Sheffield Hallam University.
Furthermore, even if Z-scores appeared to align with different TEF awards, they still could not be used to predict final outcomes in many cases, Sir Chris added. This is because they would be of no use in determining the “interesting” cases of institutions that sat right on the “cliff edge” between gold and silver or silver and bronze.
“Even if it’s the case that you can reliably predict most institutions’ performance from their metrics, the really interesting [cases] are the borderline ones where the metric performance isn’t brilliant but the account is incredibly strong,” Sir Chris said.
Paul Ashwin, professor of higher education at Lancaster University and someone who has analysed the TEF methodology closely, said that stripping back the exercise to a simple metrics assessment would raise a number of other issues.
These included throwing more of a spotlight on the suitability of the core metrics as measures of teaching and calling into question whether the TEF was needed at all if it was merely a metrics-driven exercise that was very similar to domestic rankings published in newspapers.
But he added that the most valuable aspect of the TEF as originally conceived was that it showed how a university performed against benchmarks, allowing some previously overlooked teaching-led institutions to shine. This is something that Z-scores arguably do help to measure.
The problem was that many of the changes made to the methodology of the TEF had watered down the impact of this metrics assessment, which was now the precursor to other considerations such as supplementary metrics on employment or written submissions, Professor Ashwin said.
“That intention [to assess against benchmarks] was something really important and each change has seen us move further and further away from that,” he said.
Professor Ashwin added that the tweaks to the TEF methodology also risked making it a meaningless exercise if it becomes impossible to unpick how a decision was reached.
“Questions like what is [the TEF] doing and what functions does it serve are becoming increasingly difficult to answer in a positive way, which for me is a shame as my starting point is that, given how much students are investing in higher education, they need [reliable information],” he said.
Asked if there was also a danger that the current drift away from a purely metrics-driven exercise would just make the TEF impossible to understand, especially for students, Sir Chris suggested that this was a question for those in charge of the TEF’s design, which is ultimately the government.
“My job is to deliver the TEF specification transparently, robustly and reliably, and I’ve tried to do that two years running.
“I understand that while I am doing that the TEF will evolve, and I am really looking forward to engaging positively with the review of the TEF…so that we can make sure that [its] evolution...works in the interests of students.”
Find out more about THE DataPoints
THE DataPoints is designed with the forward-looking and growth-minded institution in view


