View the 100 best liberal arts colleges in the United States
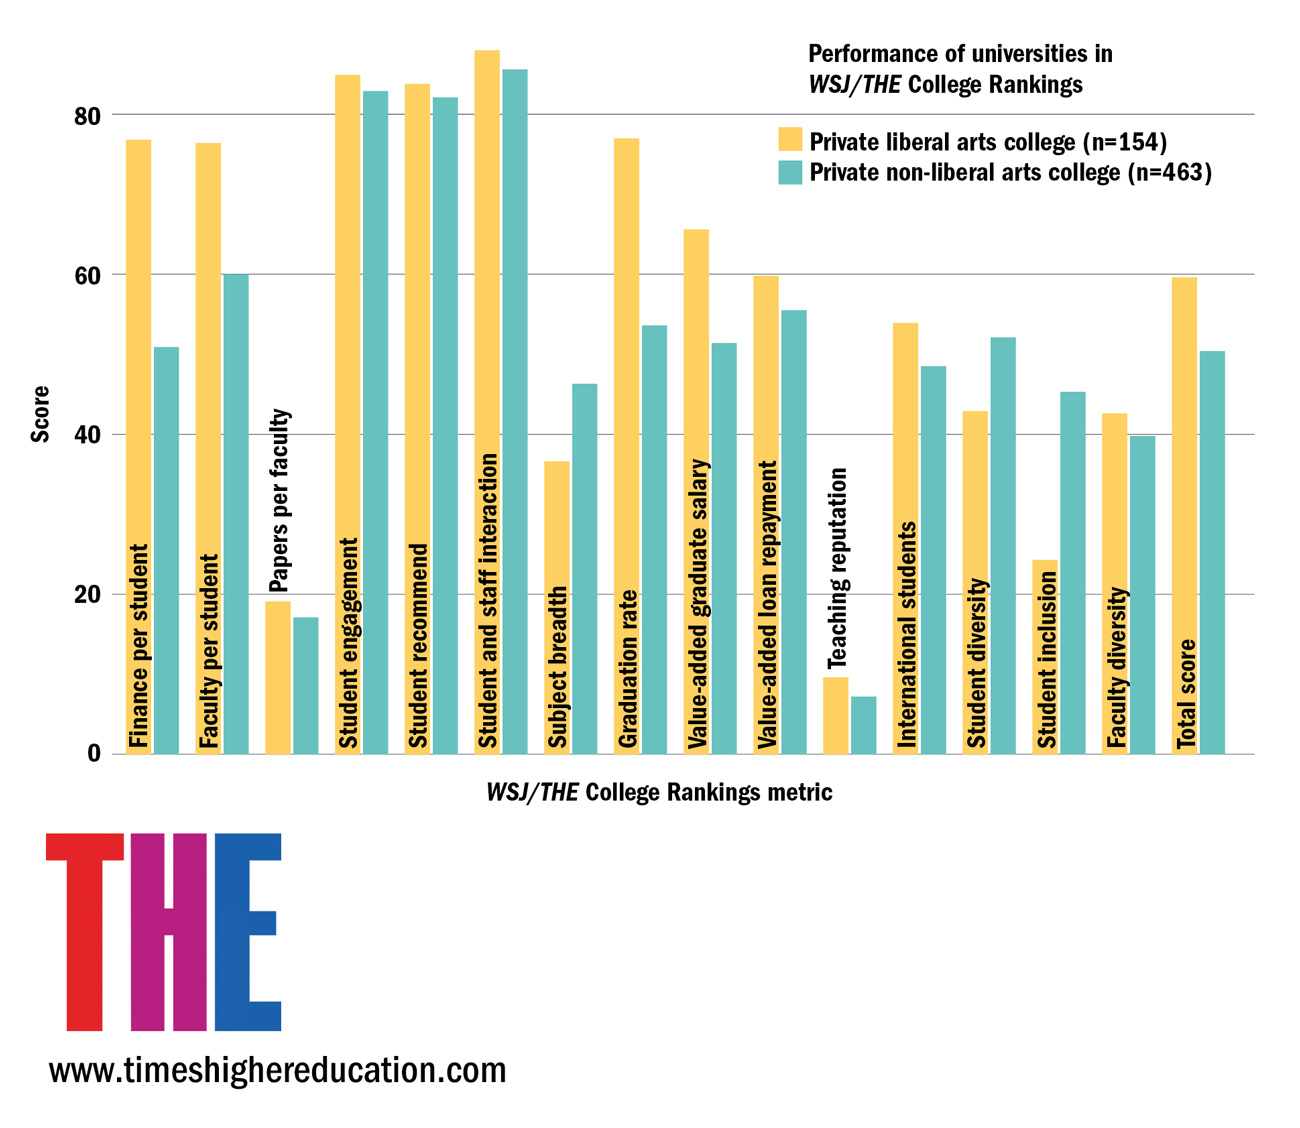
Private liberal arts colleges in the US are less diverse when it comes to the racial and socio-economic backgrounds of their students than their private non-liberal arts counterparts, according to data collected by Times Higher Education.
Analysis of data on more than 1,000 universities and colleges across the US shows that private liberal arts colleges achieve an average score of 24.1 out of 100 on a measure of their inclusion of students from poorer backgrounds, compared with 45.3 for private non-liberal arts universities.
The liberal arts colleges score 42.9 on average when it comes to racial and ethnic diversity, compared with 52.0 for the other private universities in the country.
Liberal arts colleges’ exclusivity has not gone unnoticed by students.
In a THE survey of 100,000 students at US universities, the lack of student diversity was a common complaint cited by respondents from liberal arts colleges.
Asked how their institution could improve, one student wrote of their college in Virginia: “It is very white and kind of a bubble.” Another at a college in North Carolina said: “There is so little diversity and it makes me sad to think that some of the other students may have never been around people different from themselves.”
A respondent from a liberal arts school in California noted that while “there are definitely plans” for more student diversity, the institution “shouldn’t settle for small progress in this area”.
However, despite this large discrepancy at the student level, there is little difference between the level of faculty diversity at private liberal arts colleges and other private universities. The proportion of international students at the two types of institutions is also similar.

Across the 1,061 US universities assessed, which included public institutions, universities with high levels of funding per student or high graduation rates tend to be the least inclusive of poorer students.
Liberal arts colleges score 76.9 on finance per student, compared with 50.9 for other private institutions, while they register 77.2 for graduation rates, compared with 53.6 for their non-liberal private equivalents.
The data, including the survey, were collected to create the inaugural Wall Street Journal/Times Higher Education College Rankings, published in September 2016.
Georgia Nugent, senior fellow at the Council of Independent Colleges (CIC) and former president of Kenyon College in Ohio, said that one factor that might deter black and minority ethnic students from applying to liberal arts colleges is the fact that they tend to be located in rural areas.
Minorities “may feel there will not be a community outside the college that’s there for them or they won’t have the services they would want to have in a small rural community”, she said.
Diversity at liberal arts colleges can also “suffer to some extent” from the institutions’ narrow subject breadth (they score 36.6 out of 100 on this measure, compared with 46.3 for other private universities), Dr Nugent said. Liberal arts colleges often do not offer the types of courses in finance or computing that students mistakenly believe they need “in order to have a successful life and career”.
“The leaders of corporate America have tremendously varied careers,” Dr Nugent said. “That’s something that really troubles me – young people being told that you need to narrow your life very early into a career track.”
She added that the economic benefits of studying at a liberal arts college are not well understood by the public, in particular pointing out that students at private non-profit colleges receive much more financial aid than those at public or for-profit universities.
The problem, Dr Nugent continued, is that “very bright, capable students” often do not think of applying to liberal arts colleges because they assume that they will not receive the necessary financial support.
Furthermore, students from disadvantaged backgrounds are more likely to graduate on time at liberal arts institutions, she said, thanks to typically small classes and high levels of staff-student interaction.
Top 20 liberal arts colleges according to the WSJ/THE College Rankings
| Liberal arts rank | Institution | State | WSJ/THE College Rankings |
| 1 | Williams College | Massachusetts | 22 |
| 2 | Amherst College | Massachusetts | 23 |
| 3 | Pomona College | California | 28 |
| 4 | Wellesley College | Massachusetts | =30 |
| 5 | Swarthmore College | Pennsylvania | 34 |
| 6 | Smith College | Massachusetts | 35 |
| 7 | Middlebury College | Vermont | 36 |
| =8 | Carleton College | Minnesota | =37 |
| =8 | Haverford College | Pennsylvania | =37 |
| 10 | Bowdoin College | Maine | 44 |
| 11 | Wesleyan University | Connecticut | 45 |
| 12 | Claremont McKenna College | California | 46 |
| 13 | Bryn Mawr College | Pennsylvania | 47 |
| 14 | Bucknell University | Pennsylvania | 53 |
| 15 | Colgate University | New York | =54 |
| 16 | Hamilton College | New York | 60 |
| 17 | Oberlin College | Ohio | 62 |
| 18 | Trinity College | Connecticut | 65 |
| 19 | Colby College | Maine | 66 |
| 20 | Macalester College | Minnesota | =67 |
A 2015 CIC study, “Expanding Access and Opportunity: How Small and Mid-Sized Independent Colleges Serve First-Generation and Low-Income Students”, found that 77 per cent of first-generation (the first in their family to go into higher education) students at liberal arts schools received their degree within four years of study, compared with just over half (51 per cent) at public research universities.
Even though liberal arts colleges tend to be best known for humanities subjects, the biggest difference in completion rates is seen in the sciences, Dr Nugent added.
However, despite liberal arts colleges’ poor performance when it comes to student inclusivity and diversity and their narrower subject breadth, these universities outperform other private institutions on all other measures underpinning the ranking, including student engagement, quantity of research output per faculty, value added to graduate salaries (the difference between actual and expected salary 10 years after enrolment based on underlying characteristics of students and institutions), and teaching reputation (based on a survey of leading scholars).
This means that liberal arts colleges generally achieve a much higher score in the WSJ/THE College Rankings than other universities, with an average score of 59.7, compared with 50.4 for other private institutions.
THE data scientist Bing-ru Teh said that it is not surprising that liberal arts colleges do so well in the ranking given that it is a “teaching-centric” table that was “designed to identify institutions that offer the best student experience and are the most effective at preparing students for success after graduation”.
The categorisation of liberal arts colleges was based on the 2015 Carnegie classification of US higher education institutions and the analysis included 154 private liberal arts colleges and 463 private universities. The student inclusion metric was calculated by combining the proportions of first-generation students and those receiving Pell Grants (paid to students in need of financial support). The student diversity metric was calculated by generating the probability that two students, selected at random, would come from different racial or ethnic groups.
Editor’s note: 16 June 2017
The information on this page was correct at the time of publication. Since then, Times Higher Education has reissued the US College Rankings. For the most up-to-date 2017 US College Rankings results, always use the overall league table. Click here for more information.


